Performance work on stores goes wrong in a specific and predictable way. Somebody runs a tool, gets a number out of a hundred, and the number becomes the project. Three weeks later the number is higher, the store feels exactly the same, and nobody can find the revenue.
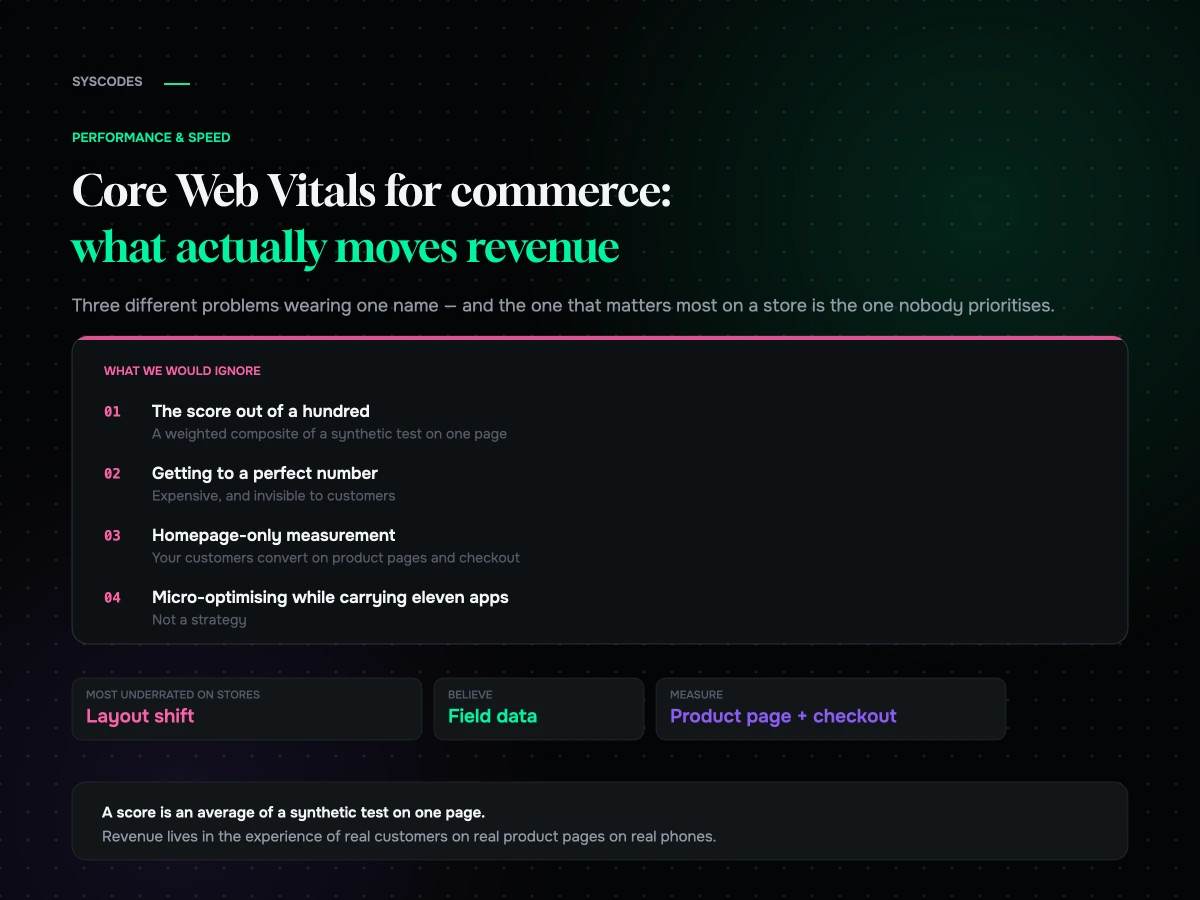
The problem is not that the metrics are wrong. Core Web Vitals measure real things that real customers experience. The problem is that a score is an average of a synthetic test on one page, and revenue lives in the experience of your actual customers on your actual product pages on their actual phones.
So: what the three metrics really measure, which ones move money on a store, what causes each of them to fail in commerce specifically, and what to ignore.
The three metrics, briefly and honestly
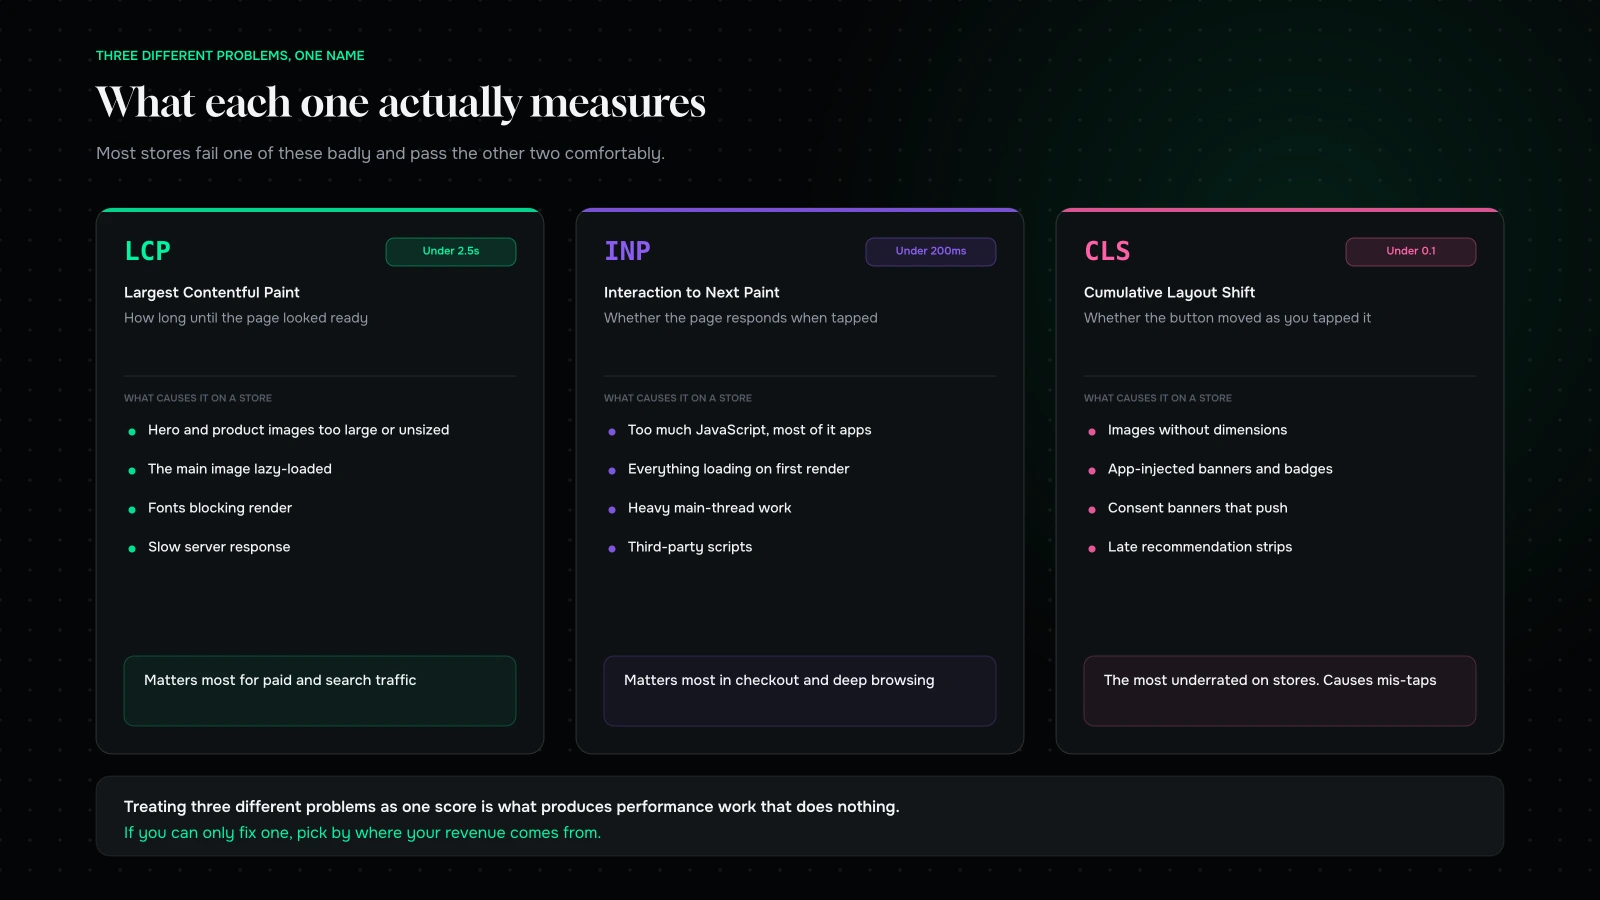
Largest Contentful Paint measures how long until the biggest thing on screen has rendered, usually your hero or your product image. It is the closest thing to “how long until this page looked ready”. Good is under two and a half seconds.
Interaction to Next Paint measures how long the page takes to visibly respond after somebody taps or clicks, not the first interaction, but the worst of them across the visit. It is the closest thing to “does this page feel responsive”. Good is under two hundred milliseconds.
Cumulative Layout Shift measures how much the page moves around after it has started rendering. It is the closest thing to “did the button jump as I tapped it”. Good is under 0.1.
Three metrics, three entirely different problems, three entirely different fixes. Treating them as one score is what produces performance work that does nothing.
Which of them actually moves money
Layout shift is the most underrated, on stores specifically. It is the one that directly causes mis-taps: a customer aims at “add to cart” and hits “size guide” because an image finished loading and pushed everything down. That is not a slow page; that is a page that took the order away from you. On mobile it is worse, because there is less room and the shift is proportionally larger.
Interaction latency is next, and it is the one most stores have quietly got worse at. Every app, pixel and personalisation script adds work to the main thread, and the symptom is a tap that appears to do nothing, followed by a second tap, followed by a duplicate action or an abandonment. Checkout is where this hurts most and where it is least often measured.
Paint time matters most for acquisition. A slow first render costs you people who arrived from an ad or a search result and have no loyalty to spend. It matters less for a returning customer with a warm cache, which is exactly why aggregate numbers mislead: your worst experience is delivered to your most expensive traffic.
If you can only fix one thing, look at where your revenue comes from. Heavy paid acquisition means paint time. Deep browsing and complex product pages means interaction latency. Image-heavy templates and injected content means layout shift.
Two things worth knowing about the metrics themselves
Interaction latency reports your worst interaction, not your first. This matters because it means a page can feel fine on arrival and still fail: the problem is often the third or fourth tap, when a script has finished loading and started competing for the main thread. Test the whole journey rather than the landing.
Layout shift is measured across the entire visit, not just the load. A banner that appears twelve seconds in, or a recommendation strip that arrives after the customer has started scrolling, counts. Stores routinely pass the initial render and fail on things that happen afterwards, and those are the shifts customers actually mis-tap on.
Both of those are reasons to stop treating performance as a page-load problem. On a store it is a session problem, and the tools that report a single load are answering an easier question than the one you have.
Field data is the only data that counts
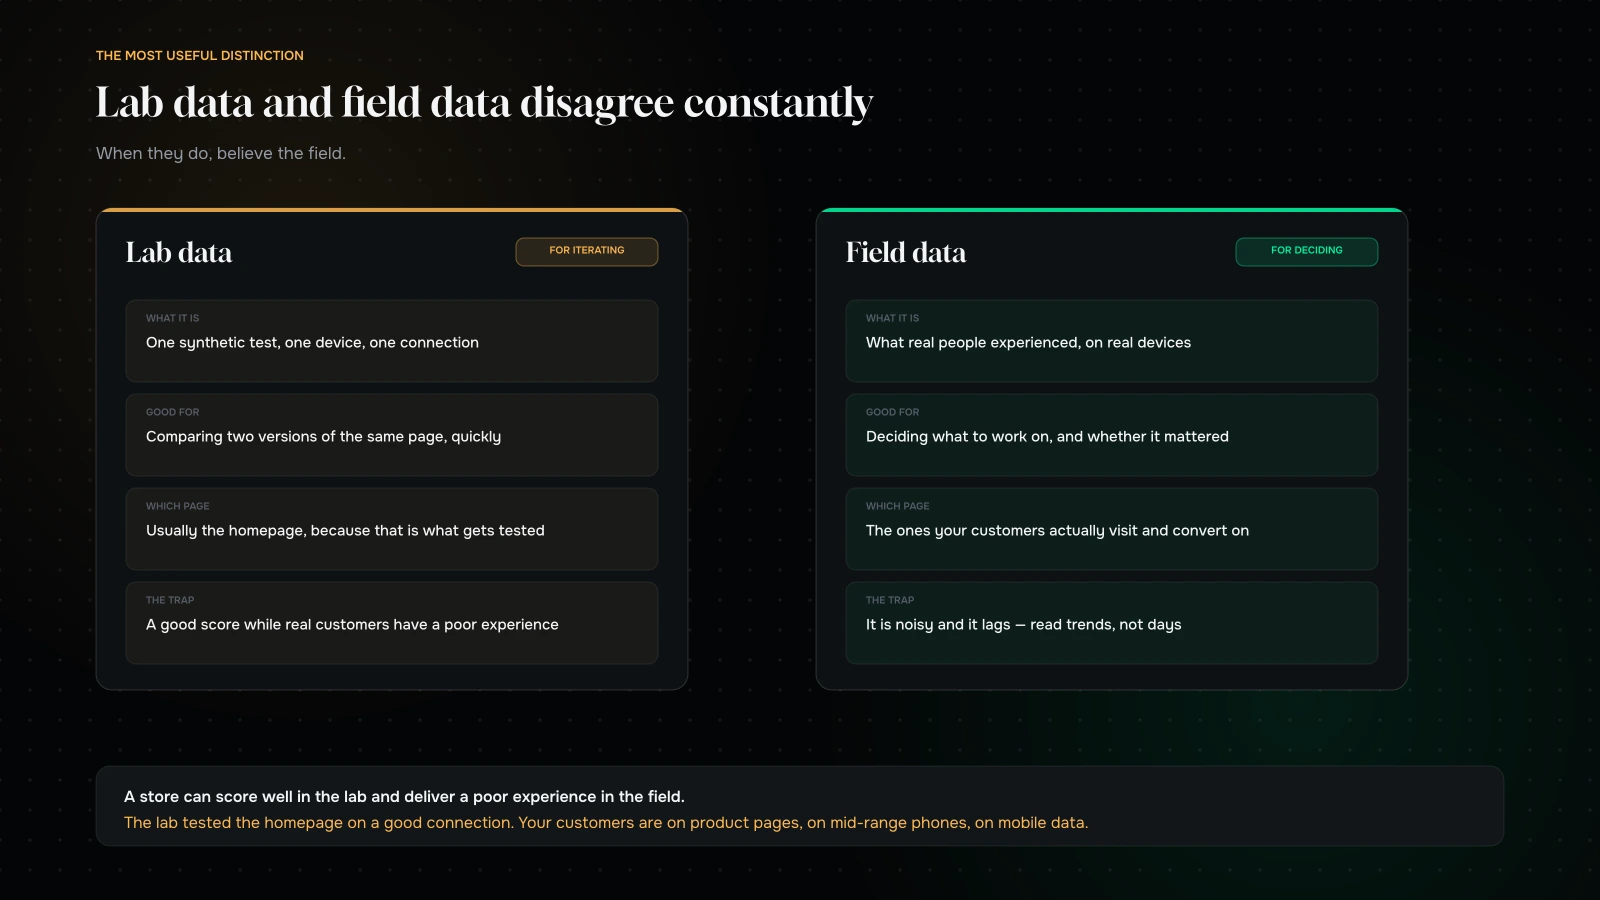
This distinction is the single most useful thing in this article.
Lab data is a synthetic test: a tool loads your page on a simulated device over a simulated connection and reports what happened. It is repeatable, which makes it good for comparing two versions of a page, and it is not your customers.
Field data is what real people actually experienced on your site, collected from real sessions, on real devices, over real connections, on the pages they actually visited. It is noisy, it lags, and it is the truth.
The two disagree constantly. A store can score well in the lab and deliver a poor experience in the field, because the lab tested the homepage on a good connection and your customers are on product pages on mid-range phones on mobile data.
Use lab data to iterate. It tells you quickly whethera change helped. Use field data to decide what to work on and whether it mattered. And when they disagree, believe the field.
What actually causes each failure on a store
Generic performance advice does not help much here, because commerce sites fail these metrics in commerce-specific ways.
Slow paint, on a store
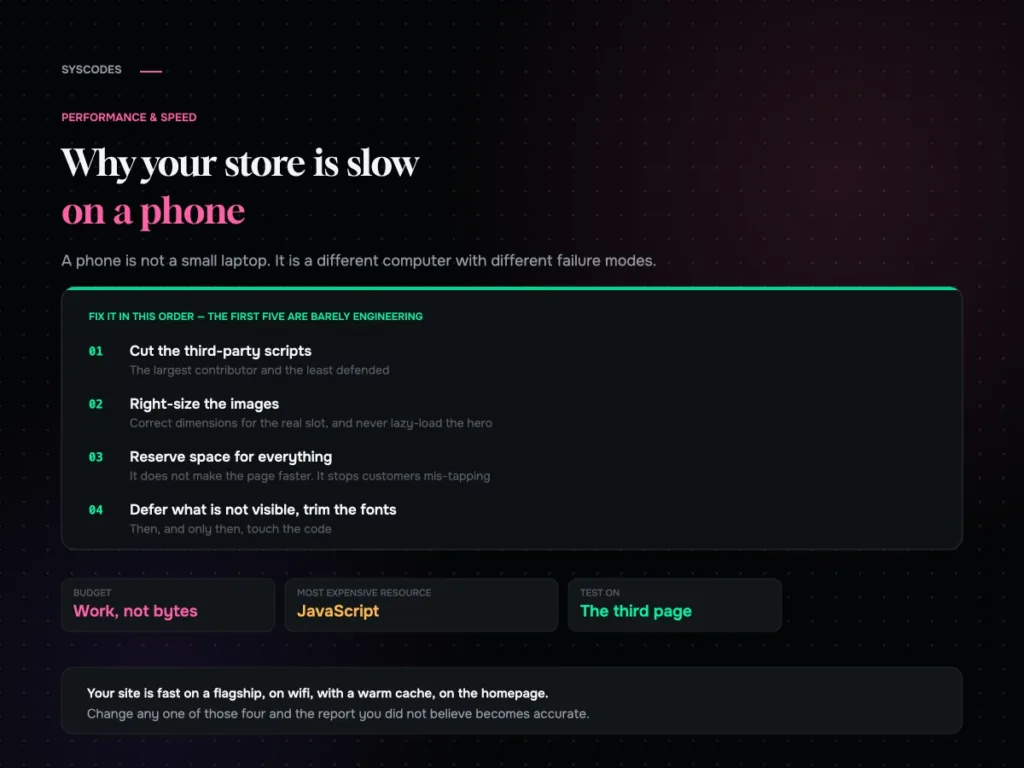
Hero and product images that are too large, in the wrong format, or not sized for the viewport. The single most common cause, and the most fixable.
Images loaded lazily that should not be. Lazy-loading the main product image delays the exact thing the metric is measuring.
Fonts blocking render, or swapping late and causing a second visible change.
Slow server response, which on many stores is theme or app code doing work on every request.
Sliders and carousels in the hero, which frequently load several images to show one.
Poor interaction latency, on a store
Too much JavaScript, most of it from apps. Reviews, chat, upsells, personalisation, analytics, a heatmap, three pixels. Each is small; the sum is not.
Everything loading at once on first render, rather than when it is needed.
Heavy work on the main thread large product option logic, price calculation, filtering alarge collection client-side.
Third-party scripts you do not control, which is most of them.
Layout shift, on a store
Images without dimensions, so the browser cannot reserve the space.
App-injected banners and badges that appear after render: free shipping bars, urgency banners, discount notices. This is the most common cause on stores and it is entirely self-inflicted.
Cookie and consent banners that push content rather than overlaying it.
Fonts swapping, which reflows text.
Dynamically-loaded product recommendations appearing above the fold.
The fixes, ranked by what they are worth
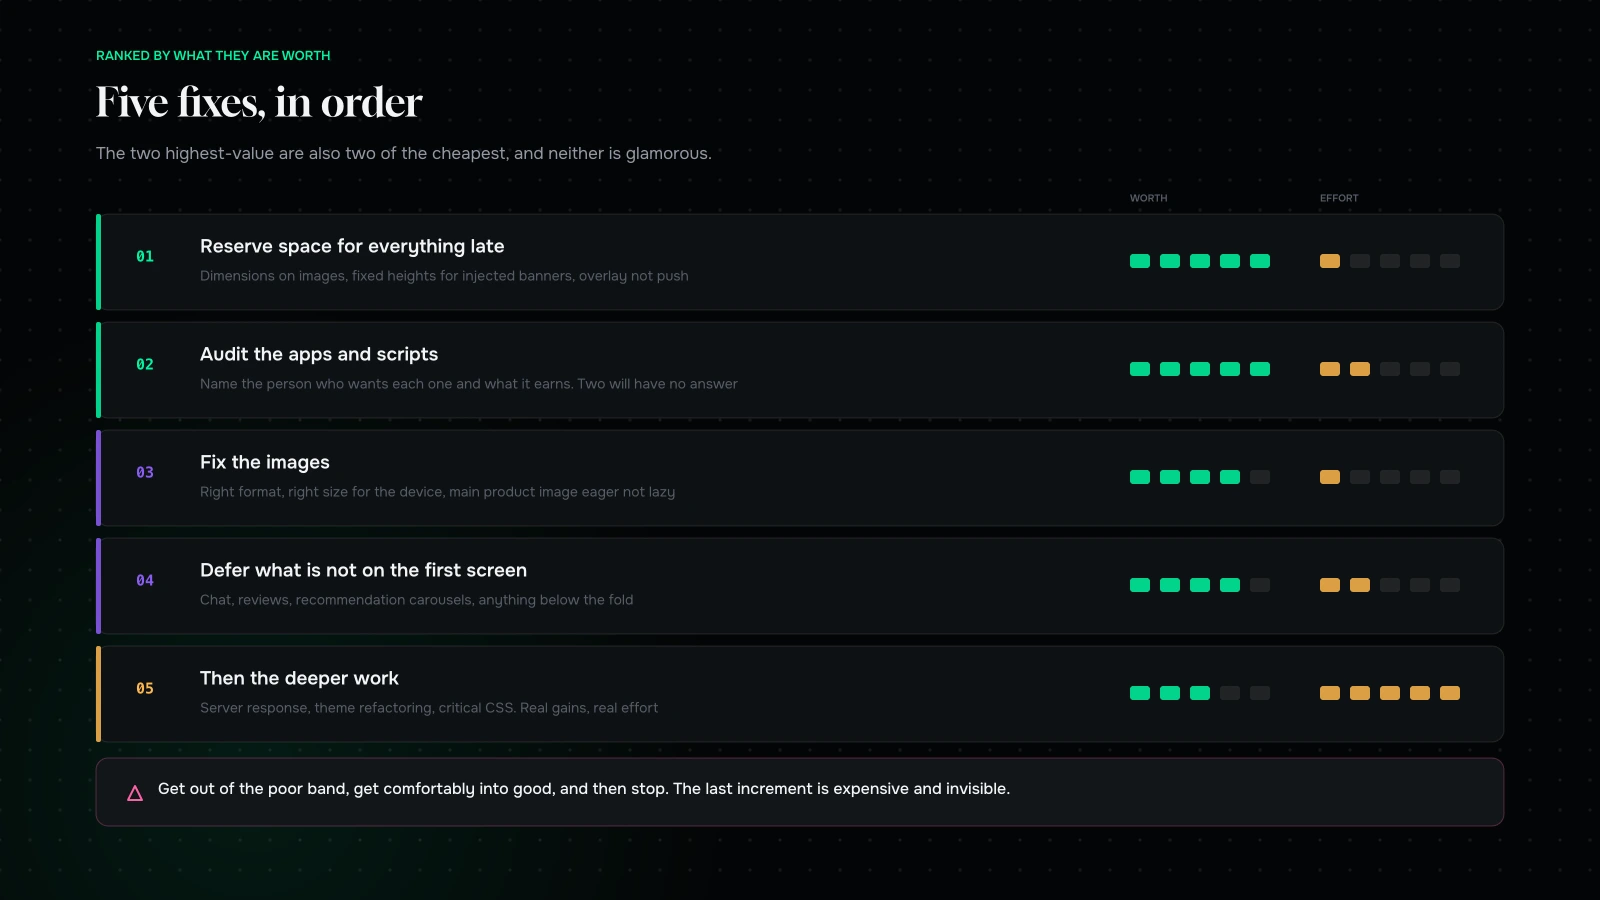
Reserve space for everything that loads late. Dimensions on images, fixed heights for injected banners, overlay rather than push for consent. This is hours of work and it directly stops customers mis-tapping. Nothing else on this list has a better ratio.
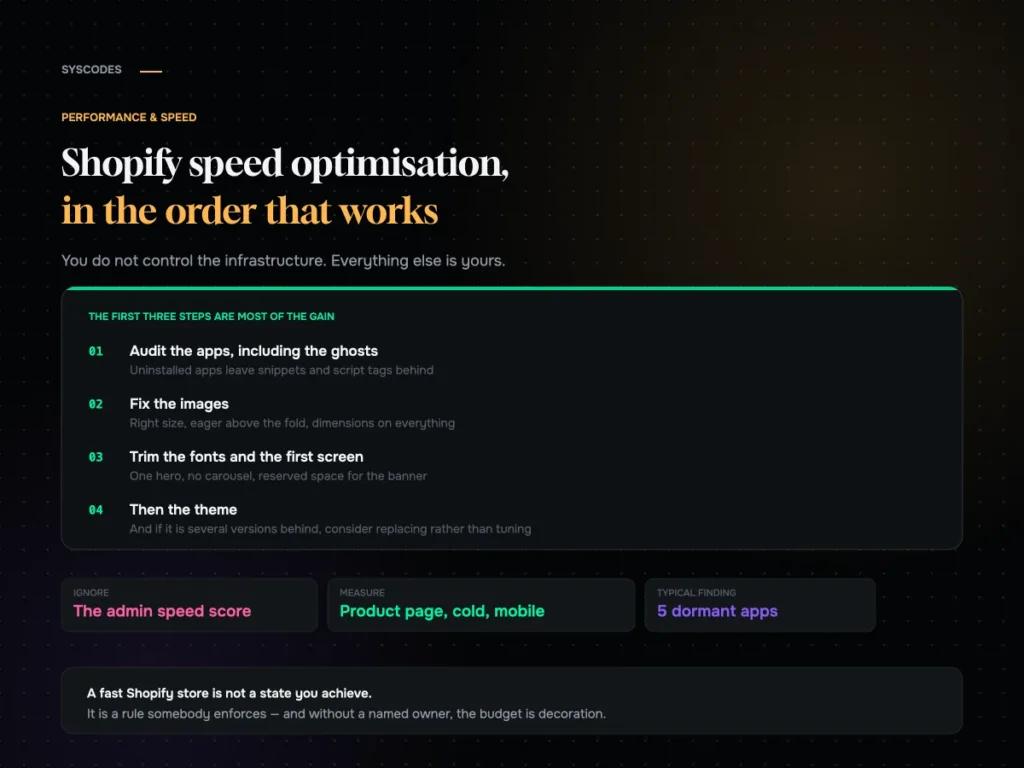
Audit the apps and scripts. List everything the page loads. For each, name the person who wants it and what it earns. You will find two or three that nobody has used in a year. Removing them is the fastest interaction-latency improvement available to almost every store.
Fix the images. Correct format, correct dimensions for the device, compressed properly, and the main product image loaded eagerly rather than lazily. Cheap, mechanical, and it moves paint time more than anything else.
Defer what is not needed for the first screen. Chat widgets, reviews below the fold, recommendation carousels, anything a customer cannot see yet.
Then, and only then, the deeper work. Server response time, theme refactoring, critical CSS. Real gains, considerably more effort, and worth doing after the cheap things, not instead of them.
The apps question, handled properly
Since app weight is the largest single contributor on most stores, it is worth having a method rather than a feeling.
Build the inventory. Every app, what it does, who asked for it, what it costs monthly, and roughly what it adds to the page. That last column is the one nobody has, and it changes the conversation entirely: “this reviews widget costs us £39 a month and 180 kilobytes on every product page” is a different sentence from “we have a reviews app”.
Classify each one. Load-bearing (removing it breaks a real business process), earning (it demonstrably produces revenue), decorative (nice, unproven), or dormant (nobody has looked at it in six months). Dormant goes immediately. Decorative goes on a review date.
Check for duplicates and conflicts. Two apps doing the same job because two people solved the same problem separately is extremely common. So is two apps both modifying the cart, which is where mystery bugs live.
Ask whether it needs to be on every page. A great deal of app weight is loaded globally when it is only needed on one template. Restricting a script to the pages that use it is often a one-line change with a measurable result.
Prefer native over app where the platform has caught up. Platforms absorb popular app functionality over time. Reviewing your app list against what your platform now does natively is a free win that most stores have never done.
The uncomfortable part of this exercise is that it is political rather than technical. Every app has somebody who wanted it, and removing it means telling them no. That is exactly why it needs a named owner with the authority to make the call.
What we would ignore
The score out of a hundred. It is a weighted composite of a synthetic test. It is useful as a rough signal and useless as a target, and optimising it directly leads people to strange places.
Getting to a perfect number. The distance from good to perfect is expensive and largely invisible to customers. Get out of the poor band, get comfortably into the good band, and spend the rest of the budget on something people can feel.
Homepage-only measurement. Your customers convert on product pages and checkout. Measure those.
Micro-optimisations while carrying eleven apps. Compressing a stylesheet while a chat widget loads two hundred kilobytes on every page is not a strategy.
Anything that trades merchandising for milliseconds. Removing product images to improve a score is a bad trade, and it happens.
Measuring it honestly
Four things, and then stop.
Watch field data for your two most important templates product page and checkout, split by device. Not the homepage, not the aggregate.
Set a budget and enforce it in review. A number for page weight and a number for third-party requests, agreed in advance. Every store gets slow the same way: one reasonable addition at a time, with nobody holding a line.
Re-measure after every app installation. Most performance regressions arrive as a well-intentioned marketing tool.
Record a video of a real checkout on a mid-range phone once a quarter. Count the seconds where nothing is happening. It is crude, it is not a metric, and it will tell your team more than any dashboard, the same approach we take to finding where mobile checkout leaks.
A ninety-minute audit you can run today
No specialist tools beyond what a browser gives you, and it will tell you most of what you need.
Minutes 0–20: get the field data. Look up your own domain in whatever field-data source you have access to, and note the three metrics for mobile. Then, crucially, look at them per page type rather than site-wide. Homepage, product page, collection, checkout. The spread between them is usually large and it is the whole story.
Minutes 20–40: count what loads. Open a product page with the network panel and a cold cache. Record total transferred bytes, number of requests, and the number of distinct third-party domains. Write those three numbers down; they are your budget baseline.
Minutes 40–60: find the layout shifts. Load the page on a throttled connection and watch it render at normal speed, then again slowly. Note every element that appears late and pushes something else. Each one is a defect with an owner.
Minutes 60–75: test interaction. Tap the things people tap: variant selectors, quantity, add to cart, the cart drawer, and note anything where the response is not immediate. Do this on a real phone, not a simulator.
Minutes 75–90: write the list. Every finding as one line, with the cause and the likely owner. You will have somewhere between six and fifteen items, most of them cheap, and roughly a third of them will be an app somebody installed and forgot.
That list is worth more than a score, because every line is actionable and attributable.
The governance part, which is what actually keeps it fast
Every store we have made fast has got slow again within eighteen months unless one of these was in place.
A written budget. Maximum page weight, maximum third-party requests, maximum main-thread work on the product template. Numbers, agreed, visible.
A rule that anything added to the storefront gets measured. Before and after, on the product page, on mobile. Five minutes per addition.
A named owner. One person who is allowed to say no to a script, and whose job includes the numbers above.
A quarterly review of what is installed. Anything nobody can defend gets removed. Almost every store carries at least two scripts nobody can defend.
None of this is technical. All of it is why performance work either sticks or evaporates, and it is the part that never appears in a performance proposal because it cannot be billed.
The business case, without overclaiming
There is a lot of enthusiastic material about performance and conversion, and much of it overstates a real effect.
What we would say honestly: performance improvements produce the clearest, most attributable revenue gains when a store is genuinely slow, when it is in the poor band on a metric that matters for its traffic mix. Moving from bad to good is worth real money. Moving from good to excellent is worth much less, and is much harder to attribute.
So the business case is not “faster sites convert better”, which is true in a way that is hard to act on. It is: we are in the poor band on interaction latency on our product pages on mobile, that is where most of our traffic is, and here are the four changes that will move it. That is a case somebody can approve, and it is measurable afterwards.
What it comes down to
Core Web Vitals are three different problems wearing one name, and the one that matters most on a store (layout shift) is the one least often prioritised, because it does not appear in the headline number people chase.
Reserve space for everything. Audit your apps. Fix your images. Defer what is not visible. Measure the field, on the pages that make money, on the devices your customers actually use. Get out of the poor band and then stop, because the last increment is expensive and nobody can feel it.
Everything else is score-chasing, and score-chasing is why performance work has a reputation for producing better numbers and the same revenue.
Want to know which of the three is costing you? Send us your store URL through the contact form and we will look at the field data for your product and checkout templates, tell you which metric is actually failing, and give you the three changes we would make first. If your site is already in the good band, we will tell you to spend the money elsewhere.
You can also read Shopify speed optimisation, in order, or why your store is slow on mobile.

Written by
Founder, Syscodes
Founder and CEO of Syscodes Infosystems Pvt. Ltd., the Kolkata studio he started in 2020. He writes about platform choices, migrations, conversion research and MVP scoping.